This post is reblogged from the Lib-Innovation blog, to tie up and follow on from the previous post on THIS blog about the Understanding Academics Project.
Understanding Academics, introduced in the last blog post, is far and away the biggest UX project we’ve attempted at York, and the processing and analysis of the data has been very different to our previous ethnographic studies. This is due to a number of factors: primarily the sheer size of the study (over 100 hours’ worth of interviews), the subject matter (in depth and open ended conversations with academics with far ranging implications for our library services), and actually the results themselves (we suspected they’d be interesting, but initial analysis showed they were SO insightful we needed to absolutely make the most of the opportunity).
Whereas for example the first UX project we ran conformed almost exactly to the expected 4:1 ratio of processing to study – in other words for every 1 hour of ethnography it took four hours to analyse and process – the total time spent on Understanding Academics will comfortably be in excess of 400 hours, and in fact has probably exceeded that already.
UX is an umbrella term which has come to mean a multi-stage process – first the ethnography to understand the users, then the design to change how the library works based on what you learned. In order to ensure we don’t drown in the ethnographic data from this project and never get as far as turning it into ‘proper’ UX with recommendations and changes, Michelle Blake and Vanya Gallimore came up with a 5 stage method of delivering the project.
Two particular aspects of this I think are really useful, and not things we’ve done in our two previous UX projects: one is assigning themes to specific teams or individuals to create recommendations from, and the other is producing and publicising recommendations as soon as possible rather than waiting until the end of the whole project.
As you can imagine the 5 stage method is very detailed but here’s a summary:
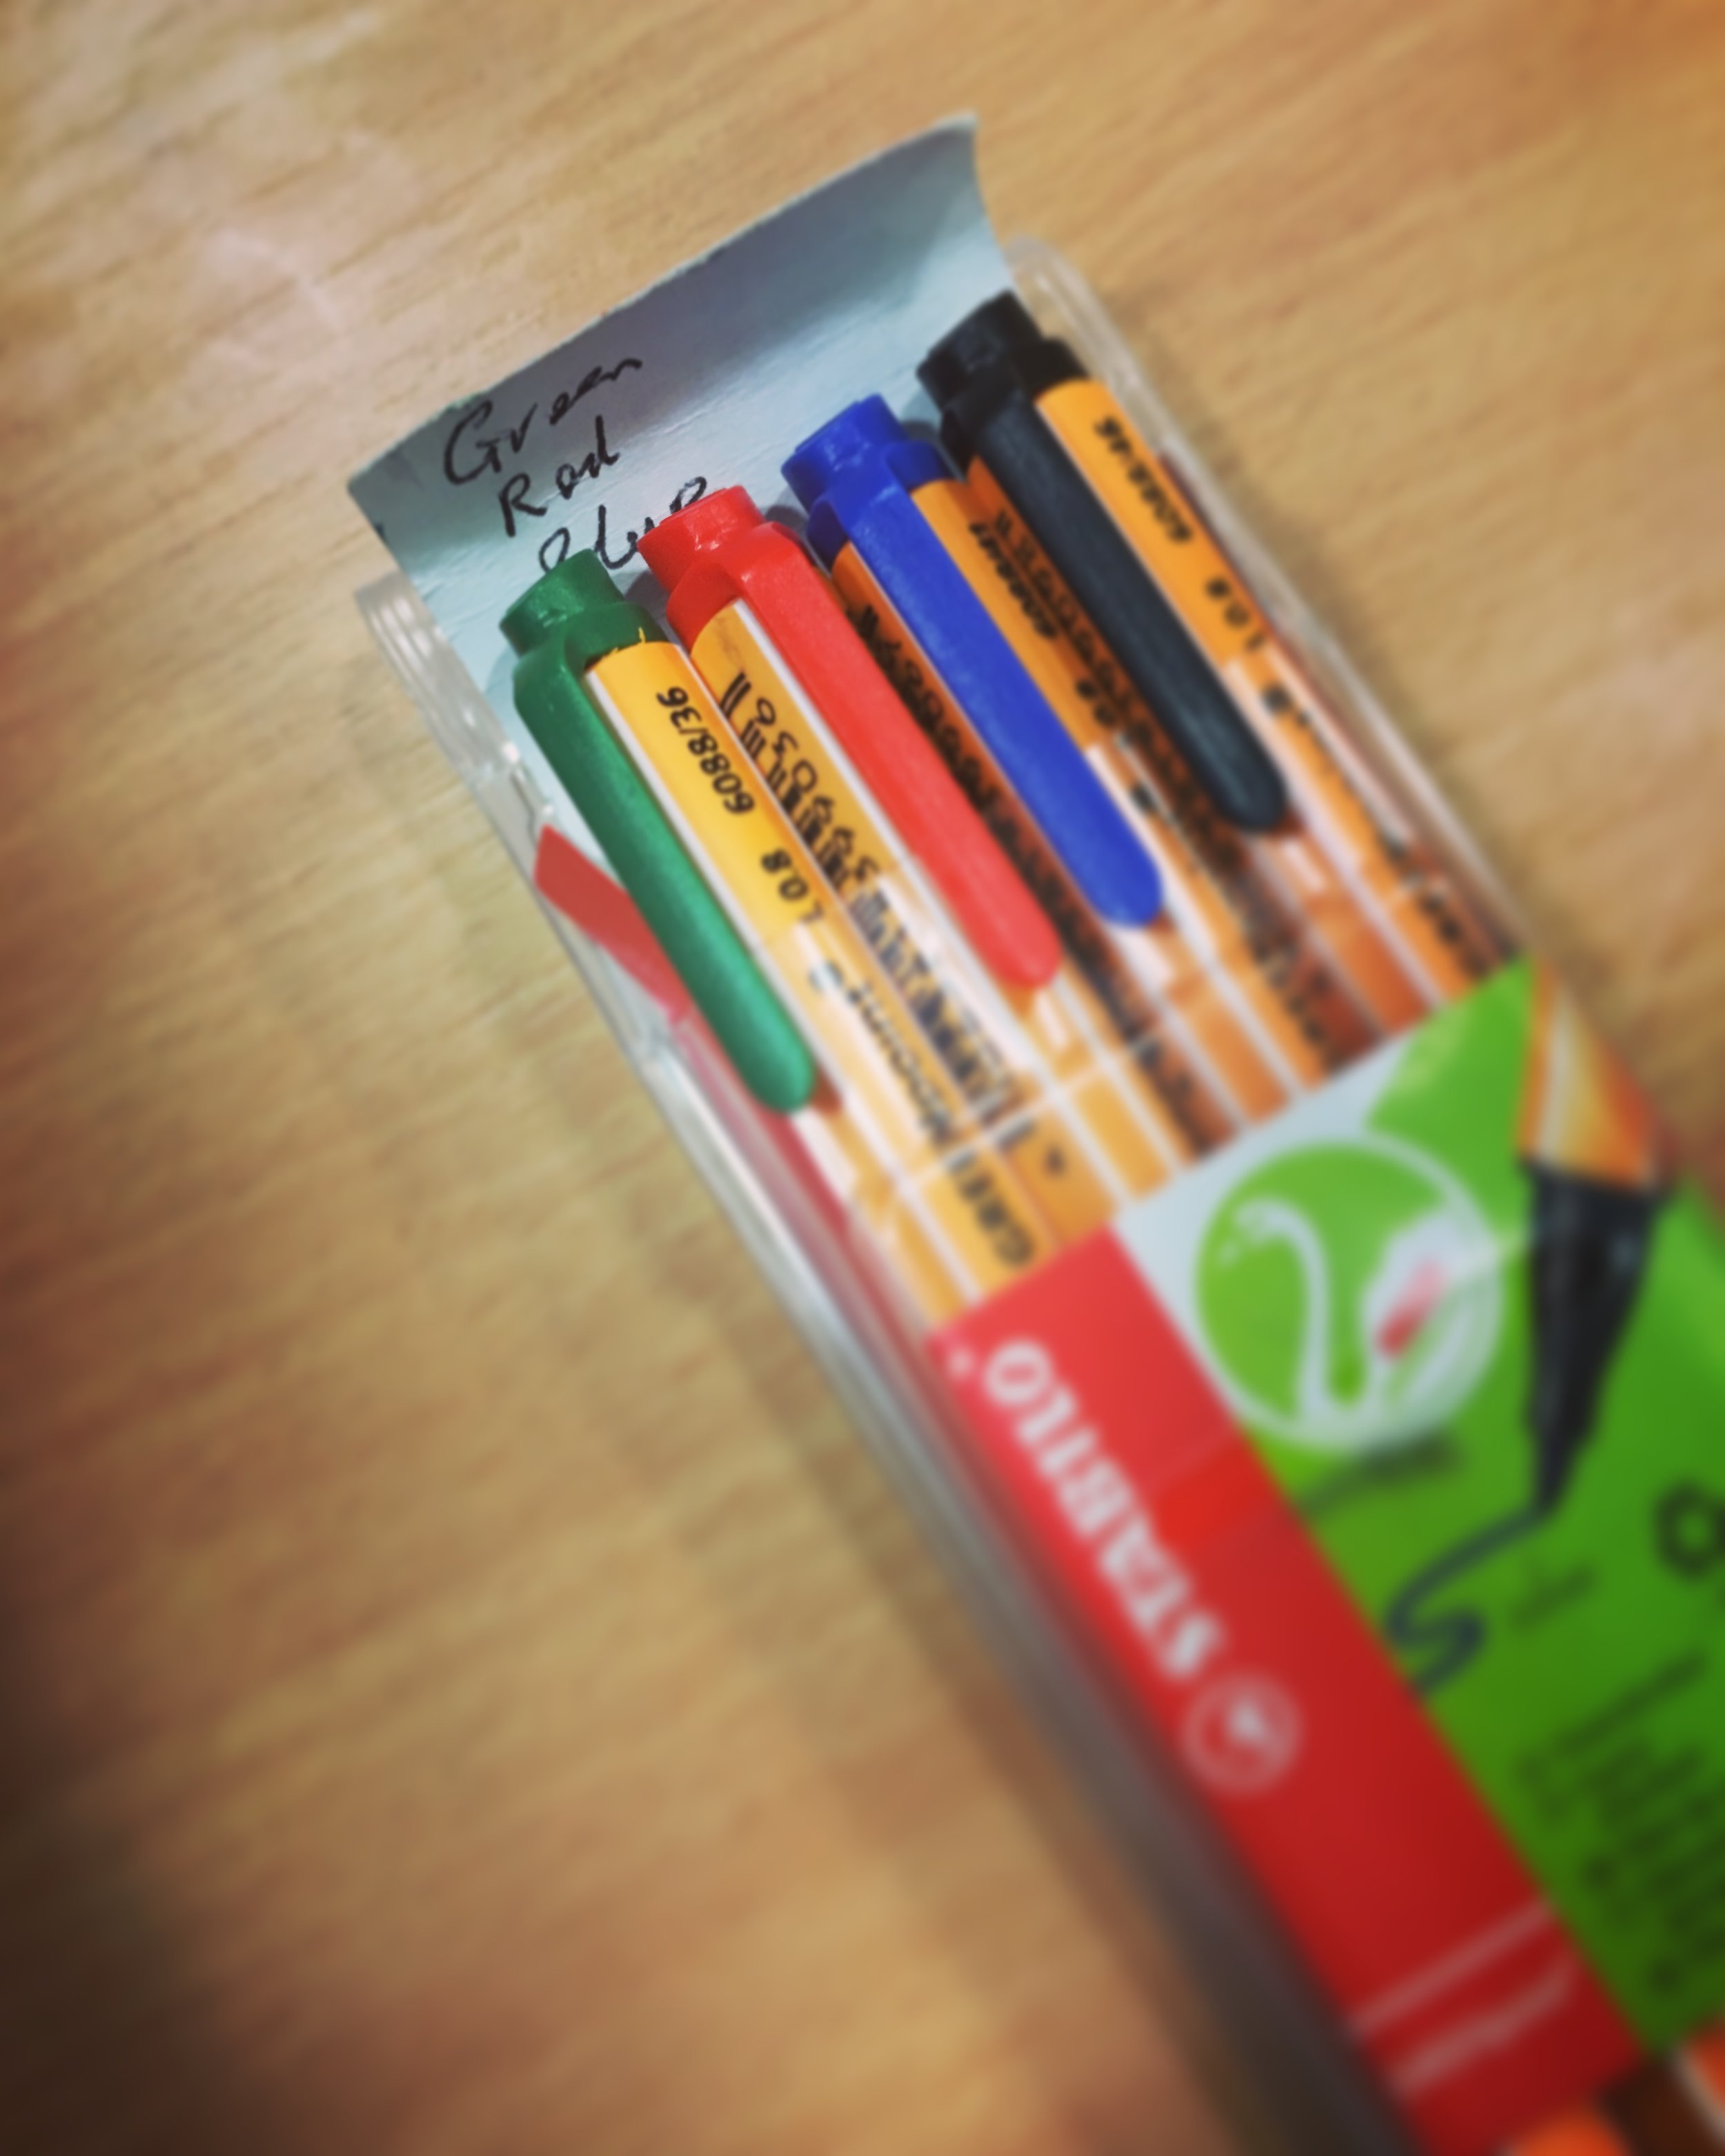
Coloured pens used in cognitive mapping (in this case with the interviewer's reminder about the order in which to use them)
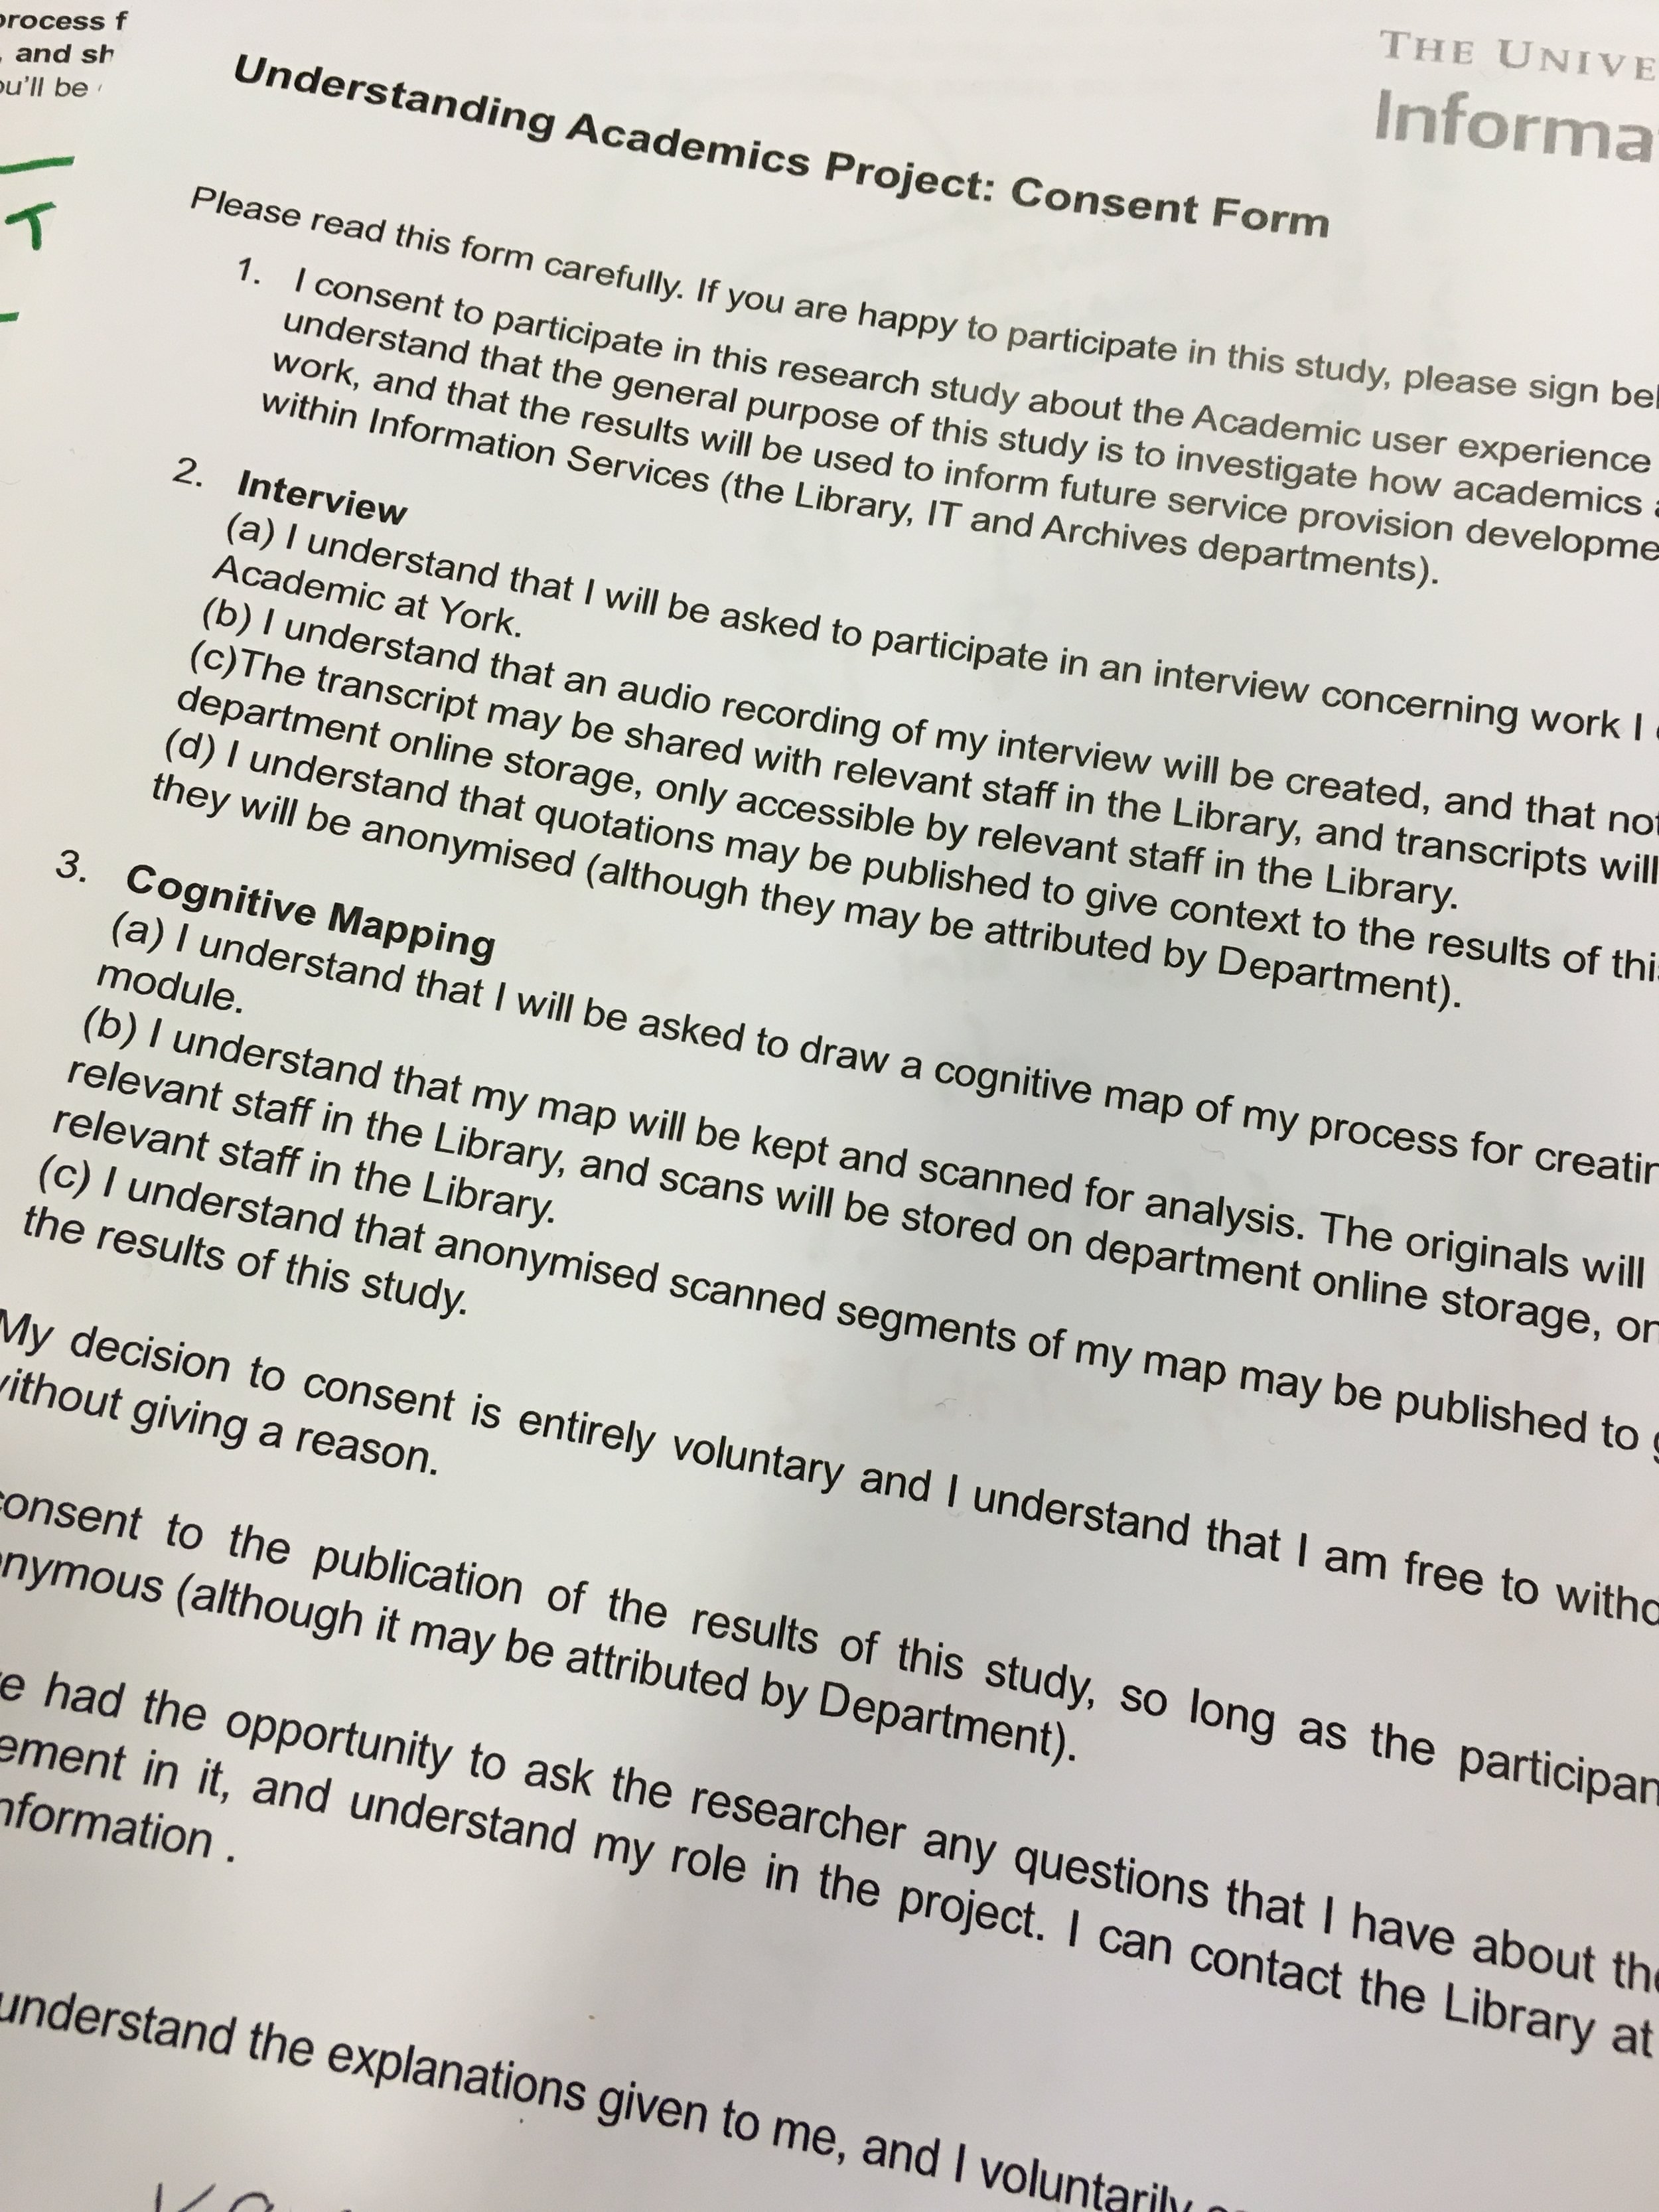
1) Conduct and write up the ethnography. Academic Liaison Librarians (ALLs) spoke to around 4 academics from each of ‘their’ Departments, usually asking the subject to draw a cognitive map relating to their working practice,
and then conducting a semi-structured interview based on the results.
The ALLs then wrote up their notes from the interviews, if necessary referring to the audio (all interviews were recorded) to transcribe sections where the notes written during the process didn’t adequately capture what was said. The interviews happened over a 2 month period, with a further month to complete the writing up.
2) Initial coding and analysis. A member of the Teaching and Learning Team (also based in the library) who has a PhD and experience of large research projects then conducted initial analysis of the entire body of 100+ interviews, using NVIVO software. The idea here was to look for trends and themes within the interviews. The theming was done based on the data, rather than pre-existing categories – a template was refined based on an initial body of analysis. In the end, 23 over-arching themes emerged – for example Teaching, Digital Tools and Social Media Use, Collaborations, Research, Working Spaces. This process took around 2 months.
3) Assigning of themes for further analysis and recommendations. Vanya then took all of the themes and assigned them (and their related data) to members of the Relationship Management Team – this consists of the Academic Liaison and Teaching and Learning teams already mentioned, and the Research Support team. This is the stage we are at now with the project – each of us in the team have been assigned one or more theme and will be doing further analysis at various times over the next 8 to 10 months based on our other commitments. A Gantt chart has been produced of who is analysing what, and when. The preparation and assigning of themes took around 2 weeks.
4) Outcomes and recommendations. There are three primary aims here. To come up with a set of practical recommendations for each of the themes of the project, which are then taken forward and implemented across the library. To come up with an evidence-base synthesis of what it means to be an academic at the University of York: a summary of how academics go about research and teaching, and what their key motivations, frustrations and aspirations are. (From this we’ll also aim to create personas to help articulate life for academics at York.) And finally to provide Information Services staff with access to data and comments on several areas in order to help inform their work – for example members of the Research Support team will have access to wealth of views on how academics think about Open Access or the repository.
These aims will be achieved with a combination of devolved analysis assigned to different groups, and top-down analysis of the everything by one individual. Due to other projects happening with the teams involved, this stage will take up to 7 months, although results will emerge sooner than that, which leads us neatly to...
5) Distribution and Dissemination. Although this is last on the list, we’re aiming to do it as swiftly as possible and where appropriate we’ll publicise results before the end of the project, so stages 4 and 5 will run simultaneously at times. The total duration from the first interview to the final report will be around 18 months, but we don’t want to wait that long to start making changes and to start telling people what we’ve learned. So, once an evidence-based recommendation has been fully realised, we’ll attempt to design the change and make it happen, and tell people what we’re doing - and in fact the hope is to have a lot of this work completed by Christmas (half a year or so before the Summer 2017 intended end date for the final report).
The full methods of dissemination are yet to decided, because it’s such a massive project and has (at a minimum) three interested audiences: York’s academic community, the rest of Information Services here, and the UX Community in Libraries more widely. We know there will be a final report of some sort, but are trying to ensure people aren’t left wading through a giant tome in order to learn about what we’ve changed. We do know that we want to use face to face briefings where possible (for example to the central University Learning and Teaching Forum), and that we’ll feedback to the 100 or so academics involved in the study before we feedback to the community more widely.
Above all, Understanding Academics has been one of the most exciting and insightful projects any of us have ever attempted in a library context.